Update to the ELK/Graphite stack
It's been a while but I just recently revisited my elk and graphite stack to deal with log events and metrics.
Yesterday
The stack was composed of:
- qnib/etcd Key/Value store updated by upcomming nodes as a startup-service.
- qnib/skydns DNS server which uses etcd as a backend and therefore is quite agile in getting new hosts in.
- qnib/carbon carbon/statsd providing storage of metrics within whisper-files (quite a bunch).
- qnib/graphite-web Oldfart way of browsing metrics, but still loved, because events could be visualized through the django framework event mechanism (which was hooked by graphite-web)
- qnib/graphite-api API part of graphite-web, but faster and cleaner
- qnib/grafana Kiabana inspired (uses the framework) metrics visualisation tool (v1.7.0)
- qnib/elk Elasticsearch/Logstash/Kibana stack, which provides an endpoint to push log events into a central system (logstash and it's various input-plugins), process them (logstash filter pugins), store them via Elasticsearch and have a powerful tool to browse and visualize the events.
Hidden features
I have been aware that it should be possible to hook grafana to Elasticsearch somehow. Which would be splendid, because all the log events are pushed and processed nicely through logstash. Instead I had to used graphite-web's ugly way of showing events ontop of (ugly to begin with) graphite-web rendered pngs.
What bothered me the most
...about the stack was the way I coupled them together. All containers were hooked to the etcd container as to sent information and to the DNS container to fetch the latest DNS magic. When I started it was a big improvement of what I have seen, but still.
The startscript of a given container was doing something along this lines:
hello etcd-server, are you thereif so, continuePush my informations to etcd(IP, hostname, services)Lets see what key/value pairs are provided by etcdas to discover what services are within my proximityAccording to that list configure the container
Kind of straight forward, but with some weird event loops, when the etcd container wants to recognize the syslog container (elk, which is started later) and configure it's logging mechanism. I toyed around with skydns as to provide most informations via DNS. Anyway, it had it's time...
Today
- qnib/consul Swiss army knife that includes a key/value store, a lightweight self-configuring Health Checking system (mini Nagios) and a DNS service.
- qnib/influxdb A storage system inspired by graphite, but written from scratch and in golang. It exposes an API to query and push metrics, is compatible with carbon-metrics clients and more.
- qnib/elk The same thing as before...
- qnib/grafana Also still the same but updated to v1.9.1
Consul
This section grew to big, I put it into a dedicated article: here
InfluxDB
InfluxDB is a datastore that was written to hold metrics information. I assume inspired by the carbon framework. The big Pros (as far as I am concernd after a couple of days playing around):
- one file deployment InfluxDB is written in GOLANG and therefore is compiled into one binary, no more python-dependency issues
- less files With carbon each metrics was put into one file. A little bit cumberome, even if it doesn't bother me that much
- SQL query language The metrics are queried with an SQL statement, including regex. Feels powerfull.
- backwards compatible Influx provides an carbon-compatible input. So it becomes a drop-i-replacement.
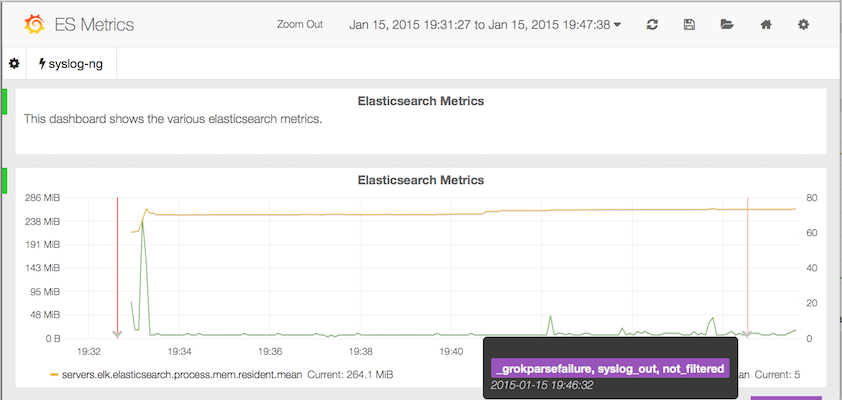
Grafana
Grafana was nice the first time, but with InfluxDB it seems to have a more powerful query language. Furthermore I have achieved to query Elasticsearch to overlay events (called Anotations). That's fantastic! A sneak preview:
Spin it up
Long story short; let's spin it up.... Instead of using ugly bash aliases I come to love fig. A simple yaml description of how the stack is composed and the rest is up to magic.
$ sudo pip install fig
$ cat << \EOF > fig.yml
grafana:
  image: qnib/grafana
  ports:
   - "80:80"
  dns: 172.17.42.1
  hostname: grafana
  links:
  - consul:consul
  privileged: true

elk:
  image: qnib/elk
  ports:
   - "9200:9200"
   - "8080:80"
   - "5514:5514/tcp"
  dns: 172.17.42.1
  hostname: elk
  links:
  - consul:consul
  volumes:
   - /data/elasticsearch:/var/lib/elasticsearch
  privileged: true

influxdb:
  image: qnib/influxdb
  ports:
   - "8083:8083"
   - "8086:8086"
   - "2003:2003"
  dns: 172.17.42.1
  hostname: influxdb
  links:
  - consul:consul
  volumes:
   - /data/influxdb/:/opt/influxdb/shared/
  privileged: true

consul:
  image: qnib/consul
  ports:
   - "8500:8500"
   - "53:8600/udp"
  dns: 172.17.42.1
  hostname: consul
EOF
$ fig up -d
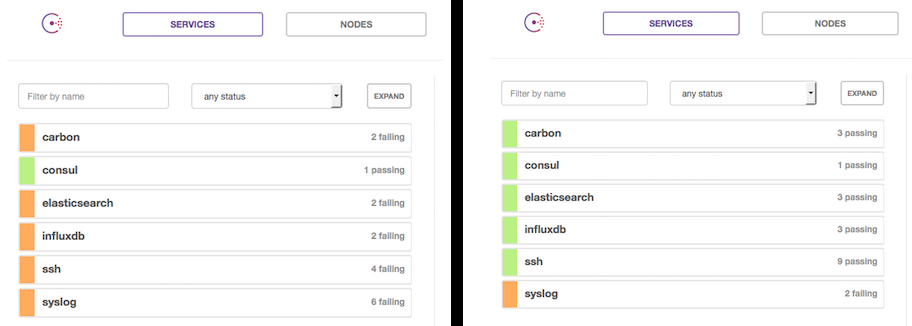
To see it grow up, hit your docker server's port 8500 (boot2docker, localhost) and watch the service in consul come up.
The following entry points are available:
- Kibana (boot2docker, localhost)
- Grafana (boot2docker, localhost)
Next stop: Put this into QNIBTerminal...