MELIG-1 M: State of InfluxDB
Today was the first instance of a M.E.L.I.G. MeetUp. The topic was about metrics in general (broad general) and what the new version of InfluxDB is going to introduce; mainly in terms of the storage backend.
We were kindly hosted by InnoQ (they have a podcast). Thanks for that...
M.E.L.I.G?
The MeetUp was a combination of a InfluxDB one and the first M.E.L.I.G. MeetUp. M.E.L.I.G. is about addressing all things related to infrastructure services around:
- Metrics: Think graphite, InfluxDB, Cyanite, OpenTSDB and a like. Including middleware such as graphite-api, carbon-relay-ng
- Events & Logs where events are business related logs you do not want to miss and generic log information that might be used for debugging purposes
- Inventory services to get to know how the infrastructure looks like and looked like in the past
- Glue like Docker, heka, fluentd, runC, storage backend and so on; basically stuff that does not fit in the other parts. :)
I would like to establish a MeetUp which addresses the ever increasing stack around infrastructure - one aspect (use-case) at a time.
To keep things reproducible I will try to provide docker stacks for all topics covered, as to allow the attendees (and others) to recreate the experience. :)
InfluxDB MeetUp today
Today I introduced the meeting by showing of some (somehow random) slides around the topic 'metrics'. I promise to improve my slides next time. Time was precious this time around. Paul Dix, the CEO of InfluxDB was kind enough to connect via Skype for insights into what the new version of InfluxDB will bring and to give an extensive Q&A.
Youtube
Click here for the complete playlist...
Intro
Metrics in General
Pauls Q&A
Metrics stack
The metrics stack I showed today can be recreated as follows. Just install docker and docker-compose and kick of the stack (OK, you need to instal git too).
$ git clone https://github.com/ChristianKniep/orchestra.git melig1
Cloning into 'melig1'...
remote: Counting objects: 557, done.
remote: Total 557 (delta 1), reused 1 (delta 1), pack-reused 555
Receiving objects: 100% (557/557), 1.53 MiB | 1.01 MiB/s, done.
Resolving deltas: 100% (229/229), done.
Checking connectivity... done.
$ cd melig1/
$ git checkout melig1 # a tag for this MeetUp, in case master does not do the trick
$ carbon-relay-ng/
$ compose pull
*snip*
$ compose up -d
Creating carbonrelayng_consul_1...
Creating carbonrelayng_carbon_1...
Creating carbonrelayng_metrics_1...
Creating carbonrelayng_gapi_1...
Creating carbonrelayng_grafana_1...
$
Open the consul WebUI by pointing our browser to the DOCKER_HOST:8500 (e.g. http://192.168.99.100:8500).
It should look somehow like this (after a moment to settle the services):
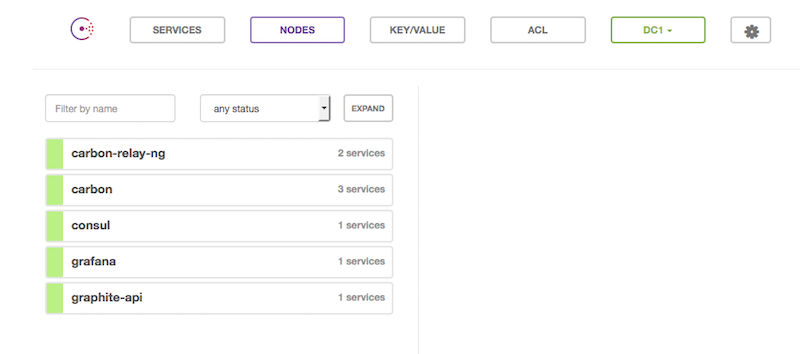
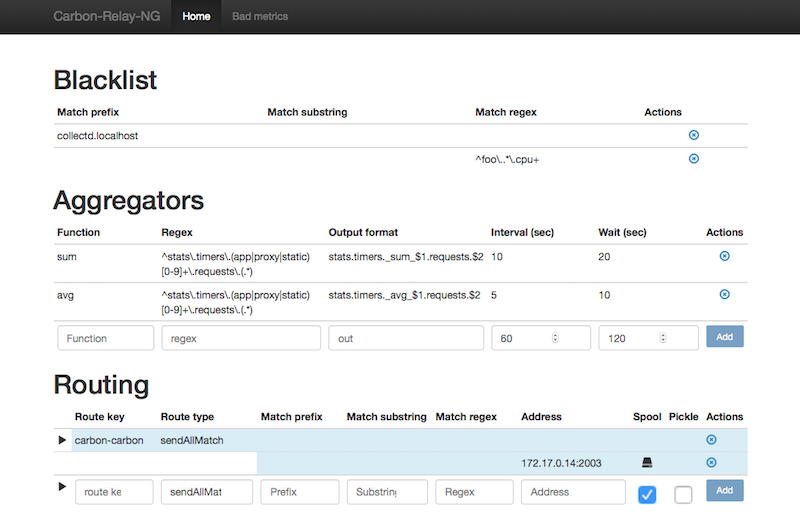
If you then hit the port 8070 you can have a look at the carbon backed metrics flowing in.
As a middleware relay carbon-relay-ng is used. It sucks in the metrics and forwards them to whatever backend is discovered by consul. For now it's only carbon.
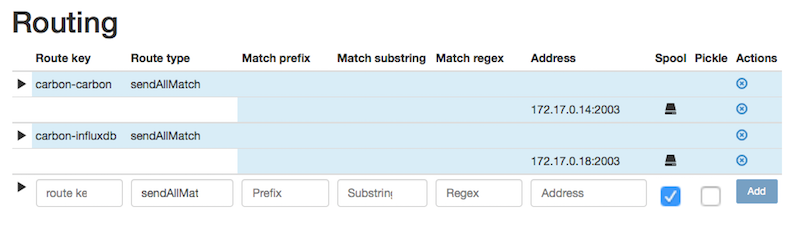
Add InfluxDB
By adding a second backend, carbon-relay-ng got a new configuration (provided by consul-template, but that's for another MeetUp) and is restarted.
$ cd add_influxdb/
$ compose up -d
Pulling influxdb (qnib/influxdb:latest)...
latest: Pulling from qnib/influxdb
Status: Downloaded newer image for qnib/influxdb:latest
Creating addinfluxdb_influxdb_1...
$
Add Grafana 2.x
Since Grafana 1. didn't quite work in my setup I introduced a second version of it.
$ cd ../add_grafana2/
$ compose up -d
Pulling grafana2 (qnib/grafana2:latest)...
Status: Downloaded newer image for qnib/grafana2:latest
Creating addgrafana2_grafana2_1...
$
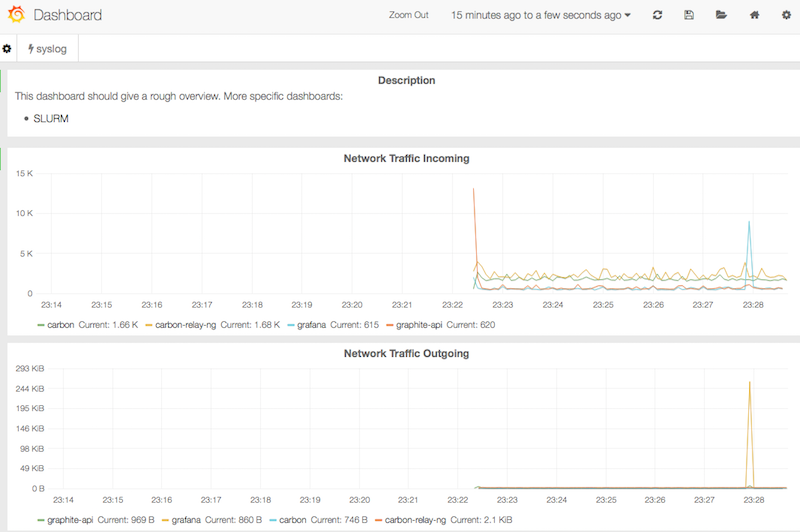
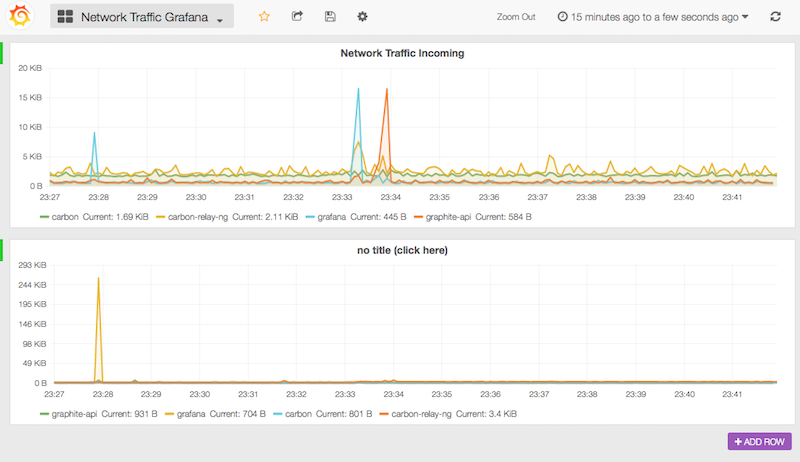
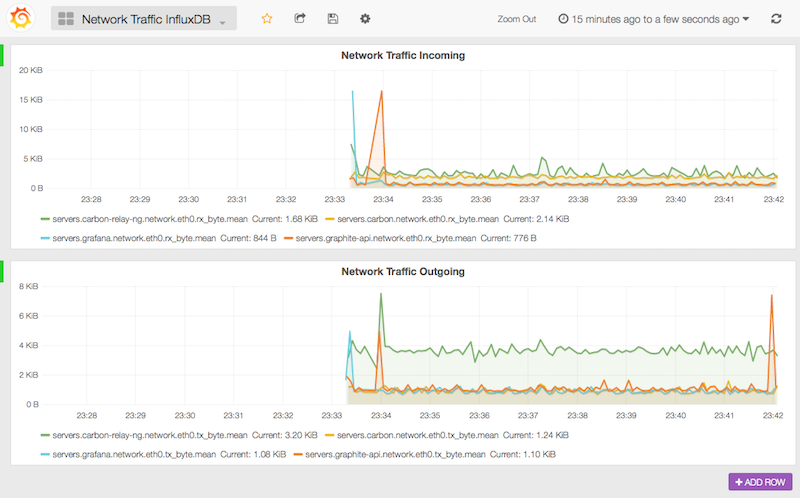
Grafana2 is accessible under :3000 and provides a dashboard which relies on the carbon and the influxdb backend.
So long...